

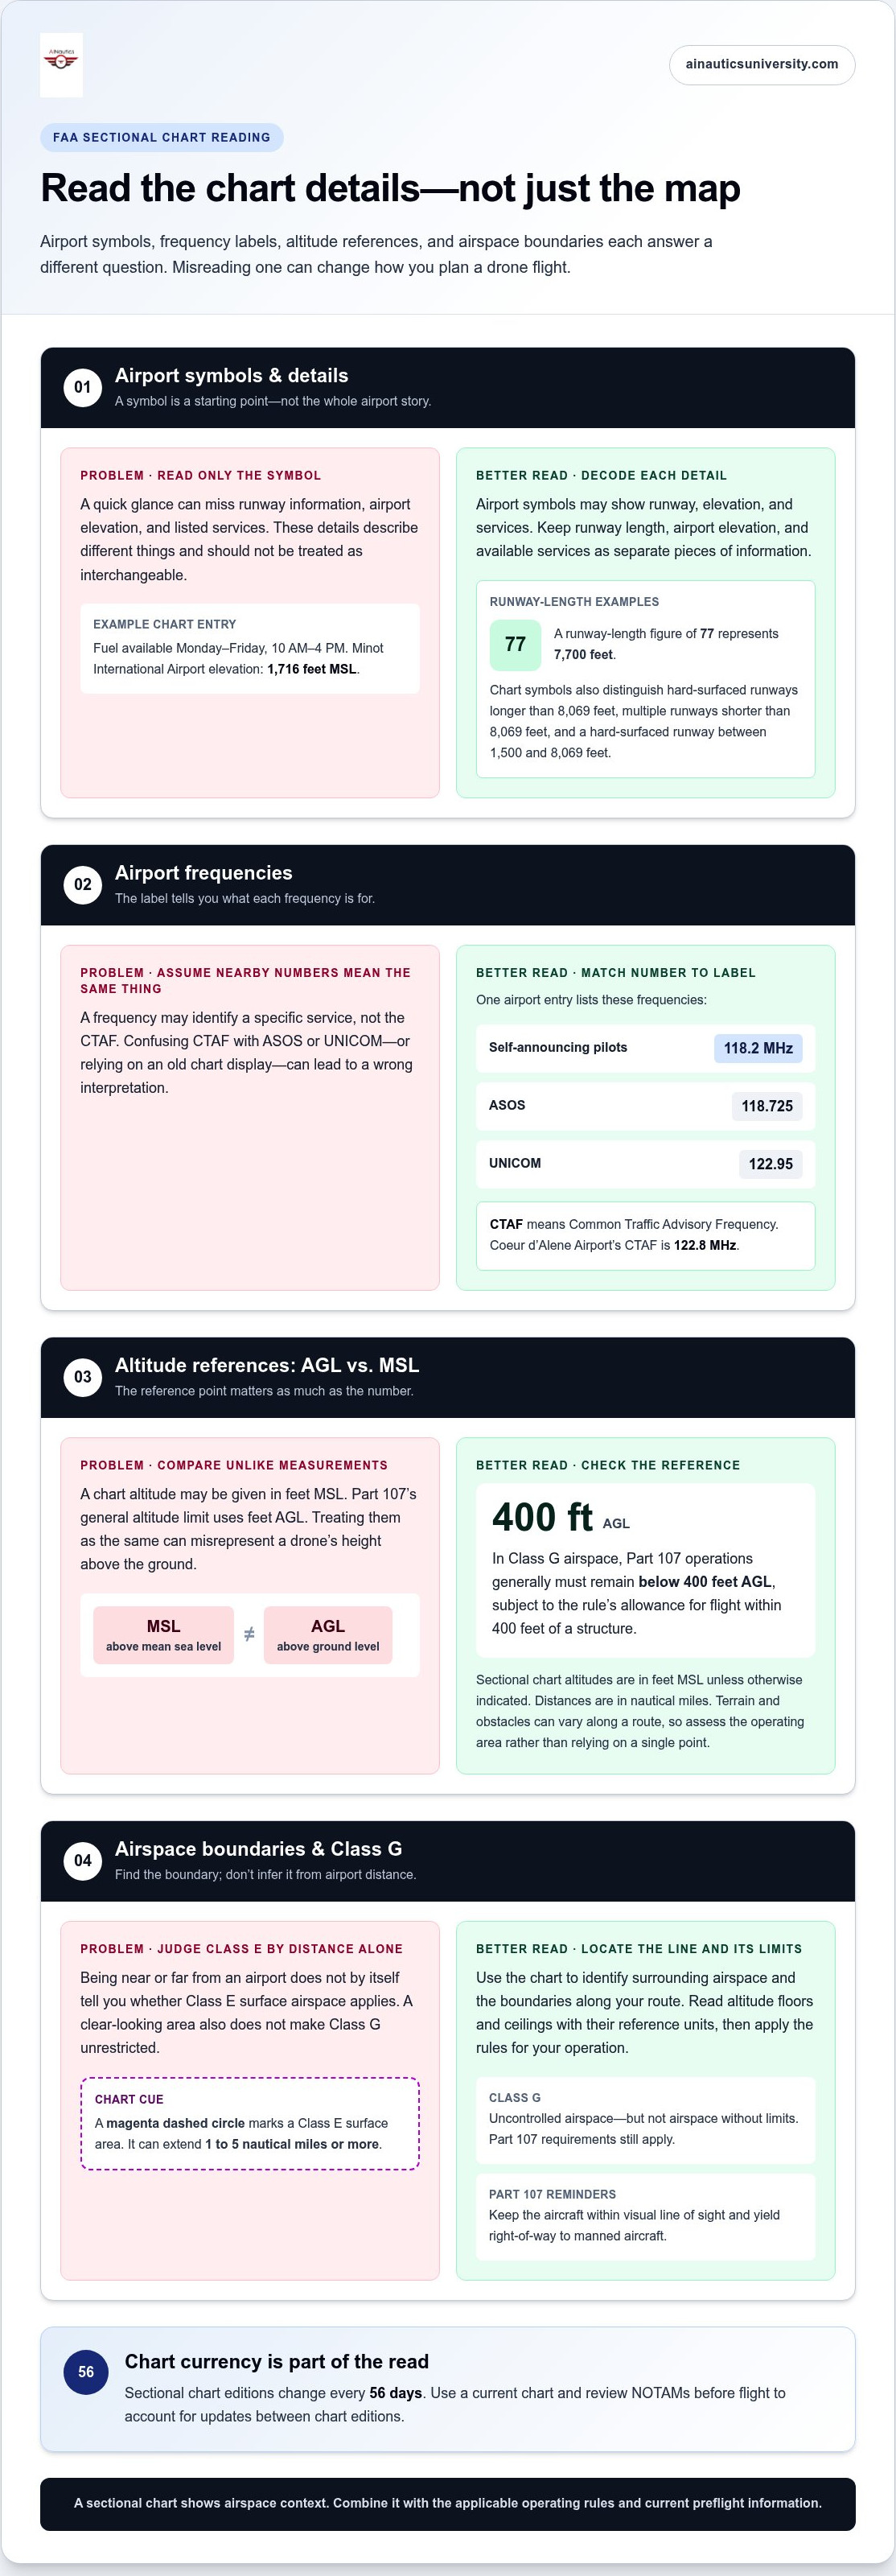
Airport distance alone doesn’t tell you whether Class E surface airspace applies. For understanding FAA sectional charts for drones, look for the airspace boundary: a magenta dashed circle marks Class E surface area, which can extend 1 to 5 nautical miles or more. In Class G airspace, Part 107 drone operations generally must remain below 400 feet AGL, according to the Federal Aviation Administration.
Sectional charts can look crowded at first, with airport symbols, airspace boundaries, and radio frequencies appearing together. Understanding FAA sectional charts for drones means learning how these details relate, so you can interpret the airspace around a planned flight and identify information that needs a closer look.
This guide explains how to read airport symbols and find CTAF frequencies, understand Class G limits and distinguish Class E surface boundaries. You’ll also learn why chart editions change every 56 days and what to review before flying, so you can build a more reliable chart-reading routine.
Key Takeaways
- Use airport symbols and chart details to identify runway information, elevation, and available radio frequencies.
- In Class G airspace, Part 107 operations generally stay below 400 feet AGL, subject to the rule’s allowance for flight within 400 feet of a structure, according to the Federal Aviation Administration.
- Read the CTAF frequency printed near an airport to identify the frequency used for pilot self-announcements.
- Look for magenta dashed boundaries to spot Class E surface areas; airport distance alone doesn’t determine whether one applies.
- Use a current sectional chart and review NOTAMs before flight to account for updates between chart editions.
Airport symbols and airport information
Airport symbols bring together runway details, elevation, services, and radio frequencies. Reading each item in context helps you identify nearby airports and understand the information shown on the chart.
Airport Symbol Identification
An airport symbol marks an airport and may include details about its runway, elevation, and services. Those details help drone pilots understand the type of aviation activity represented on the chart. For example, a runway-length figure of 77 represents 7,700 feet. Some symbols represent hard-surfaced runways longer than 8069 feet, or multiple runways shorter than 8069 feet; another symbol represents a hard-surfaced runway between 1500 and 8069 feet.
A sectional chart shows airports alongside airspace boundaries, terrain, obstacles, and other aviation information, giving you a broader view than a tool focused only on drone airspace access. LAANC maps support requests for near-real-time authorization in controlled airspace, while UAS Facility Maps show information used to support those requests. Each serves a different purpose, so don’t treat one as a substitute for the others.
Read the airport’s chart details together rather than relying on its symbol alone. A sample airport entry shows fuel available Monday through Friday from 10 AM to 4 PM. Minot International Airport is shown at 1716 feet MSL. Those details describe different things: services and airport elevation. Keep them distinct when planning and interpreting the chart.
Locating Airport Frequencies
Airport frequencies appear in chart information near the airport symbol, often as abbreviated labels with numbers. Identifying the label matters because a frequency may refer to a specific service, rather than the CTAF. For example, one airport entry lists 118.2 MHz for self-announcing pilots, 118.725 for ASOS, and 122.95 for UNICOM. Coeur d’Alene Airport’s CTAF is 122.8 MHz.
Match each number to its label before interpreting it. CTAF means Common Traffic Advisory Frequency, the frequency identified for airport traffic announcements. Don’t assume a nearby frequency serves the same purpose. A common mistake is confusing CTAF with ASOS or UNICOM, or relying on an old chart display without checking current information.
Altitude Floors and Ceilings
Floor and ceiling figures show the lower and upper limits of an airspace area. These matter because an airspace boundary has both a horizontal position and a vertical limit. Read the figures together, and note whether an altitude is stated in feet MSL, meaning above mean sea level, or uses another reference.
Sectional charts use altitude information to describe airspace layers, not simply distance from an airport. A common error is treating every charted altitude as height above the ground. Pay attention to the chart’s conventions: distances are in nautical miles, and altitudes are in feet above Mean Sea Level unless otherwise indicated.
Sectional chart rules don't change with the pilot category, but the operating rules do. Recreational pilots and Part 107 operators must apply the requirements relevant to their operation; a chart helps show the airspace context, not which category a flight follows.
Class G airspace and drone flight limits
Class G is uncontrolled airspace, but “uncontrolled” doesn’t mean a drone flight has no limits. A sectional chart helps you identify surrounding airspace and nearby boundaries; you must also apply the rules for your operation. Use the chart as one part of planning, not as permission to fly at any altitude or location.
For a Part 107 operation, the key height reference is above ground level, or AGL. According to the Federal Aviation Administration, U.S. Part 107 drone operations generally must remain below 400 feet AGL, subject to the rule’s allowance for flight within 400 feet of a structure. AGL measures height above the ground below the aircraft, unlike MSL, which measures altitude above mean sea level.
That distinction matters when a sectional chart displays terrain elevation or an altitude figure. A chart altitude may use MSL unless otherwise indicated, while the Part 107 limit uses AGL. Don’t compare those numbers as if they shared the same starting point. For example, a planned drone height above a hilltop and the hill’s elevation above sea level describe different measurements.
Use the chart to understand the airspace around your intended route. Identify the location, read the surrounding boundaries and labels, then consider the flight’s height relative to the ground. A chart can show where airspace changes, but a visual boundary alone doesn’t tell you an aircraft’s height above terrain. Terrain and obstacles can vary along a route, so assess the operating area instead of relying on a single point.
Keep the aircraft within visual line of sight and yield right-of-way to manned aircraft during Part 107 operations. Those requirements remain relevant even when the flight is in Class G. A clear patch of chart without a nearby controlled-airspace boundary doesn’t remove the need to monitor the surroundings and maintain the required separation.
Common planning errors include confusing AGL with MSL, reading only the map location, or treating Class G as unrestricted airspace. Another is assuming the chart alone answers every question about a flight. Combine its airspace picture with the applicable operating rules and current preflight information. If your route approaches a boundary, inspect the chart closely and identify the airspace on each side.
Build chart-reading confidence by practicing how terrain, altitude references, and airspace labels relate. A drone simulator can support flight-planning practice, helping learners connect chart interpretation with decisions made during a simulated flight.
Reading CTAF frequencies on sectional charts
CTAF means Common Traffic Advisory Frequency. On a sectional chart, it identifies a radio frequency associated with airport traffic announcements. Read the frequency alongside its label instead of treating every number near an airport symbol as the same kind of information. This helps drone pilots interpret airport details without confusing CTAF with another listed service.
Find the airport symbol, then inspect the nearby information for a frequency marked CTAF. The value is expressed in MHz, such as Coeur d’Alene Airport’s CTAF of 122.8 MHz. The airport name and CTAF label connect that frequency to the correct location. If a chart shows several airport-related numbers, identify each label before deciding what information it represents.
CTAF entries help pilots identify the frequency associated with airport traffic announcements. This frequency information provides aviation context, not drone airspace authorization. Don’t interpret a CTAF listing as permission to fly near an airport or as proof that the surrounding airspace is uncontrolled. The location and charted airspace boundaries are essential parts of the picture.
Distinguish CTAF from other airport frequency labels. An airport entry may also show ASOS, which provides automated weather information, or UNICOM, an airport advisory service. A number printed near the same airport doesn’t become CTAF just because it appears beside the airport symbol. Read the abbreviation, then match it to the frequency. This simple check prevents a common chart-reading error: assigning the right number to the wrong service.
Use a consistent sequence when reviewing a sectional chart for a planned flight:
- Locate the airport symbol nearest the operating area.
- Read the airport name and associated frequency labels.
- Identify the value specifically marked CTAF, including its MHz unit.
- Review the surrounding airspace boundaries separately from the frequency entry.
This sequence separates location, radio information, and airspace. For instance, seeing Coeur d’Alene Airport’s 122.8 MHz CTAF tells you which frequency the chart associates with that airport’s traffic announcements. It doesn’t tell you whether a planned drone flight is authorized, or whether the aircraft can safely operate there. Those decisions depend on the applicable airspace rules and the flight’s circumstances, not the CTAF number alone.
A frequent mistake is reading a frequency without its label and assuming it describes airport traffic. Another is treating a sectional chart as a live radio display. The chart is a reference for published airport information, so keep frequency identification separate from flight authorization and operational planning.
Sectional chart update cycle and preflight checks
FAA sectional charts are updated every 56 days, so an edition can become outdated after publication. Before flight, compare the chart edition with current notices and supporting aviation information.
Chart Update Timing
The sectional chart update cycle is the interval between new chart editions. At 56 days, the cycle gives pilots a clear reason to check edition dates before using a chart for navigation. A familiar airport symbol or boundary may not reflect later changes if the chart is obsolete.
Updates don’t eliminate the need to review information issued between editions. Check NOTAMs for important changes, and remember that the FAA prepares the Notice to Airmen Publication every 28 days. The chart and notice publication follow different cycles, so a new chart edition alone doesn’t replace checking notices relevant to the planned flight.
Preflight Chart Checks
A preflight chart check compares your planned flight area with current chart and notice information. Confirm that the sectional chart is the current edition, then review the route, nearby airspace boundaries, airports, and charted obstacles. This helps you identify relevant details before navigation begins.
Use the Chart Supplement and the Safety Alerts/Charting Notices page of the Aeronautical Information Services website as additional aviation references. Review NOTAMs for updates that could affect your flight area or timing. These checks add context to the chart; they don’t change what it depicts.
Make chart review part of your flight-planning routine rather than relying on your memory of a previous trip. A chart used for an earlier flight may no longer be current, even if the location and route are unchanged. Confirm the edition date each time, and replace obsolete charts and publications with current editions.
For a practical review, keep the checks distinct:
- Confirm the sectional chart’s edition is current.
- Locate the planned operating area and review its airspace, airports, and obstacles.
- Check NOTAMs for updates between chart and publication cycles.
- Consult the Chart Supplement and relevant Safety Alerts/Charting Notices.
- Set aside obsolete charts and publications so they aren’t mistaken for current references.
For example, a chart that is several weeks old still needs an edition check before use. Even if its airport symbols look familiar, review current notices for changes affecting the area. The 56-day chart cycle and 28-day Notice to Airmen Publication cycle are separate timing cues, not substitutes for checking each source.
Consistent checks make chart information more useful for navigation and preflight decisions. Confirm the chart’s edition before treating it as a current reference, then use notices and aviation supplements to catch intervening updates. This routine helps prevent a simple planning error: relying on a familiar but obsolete chart.
What are the FAA altitude limits shown on sectional charts, including floor and ceiling markings?
Altitude limits describe the vertical span of an airspace area. The floor is its lower boundary; the ceiling is its upper boundary. Read both values to understand where the area begins and ends vertically. Charted altitudes usually use feet above mean sea level unless otherwise indicated, while some drone limits use height above ground level. These reference points aren’t interchangeable.
Class A airspace extends from 18,000 feet to 60,000 feet. That high-altitude range differs from lower airspace around airports, where sectional charts may show a floor at the surface and a ceiling measured in thousands of feet. Class A airspace is a high-altitude layer that is not relevant to most drone flight planning. The figures still help explain how sectional charts represent vertical layers, even when those layers sit far above a typical drone flight.
Class B boundaries can have different floors and ceilings within the same general airspace structure. One chart example shows a section extending from the surface to 9000 feet. Other sections have bases at 2700 feet or 4000 feet, each with a ceiling at 9000 feet. Read the base and ceiling for the specific section covering the planned location; don’t assume a nearby section has matching limits.
Class E can begin at the surface, with charted surface areas extending up to 700 feet. A magenta dashed boundary can mark Class E surface airspace around an airport. Outside the shaded magenta area, Class E may begin at 1,200 feet AGL. Drones staying below that level don’t need authorization for that airspace. The boundary’s location and the altitude reference both matter.
Keep these distinctions in mind when reading charted floors and ceilings:
- Check whether the altitude is a floor, a ceiling, or a full vertical range.
- Identify the airspace class and the exact chart section covering your location.
- Note whether the figure uses MSL or AGL.
- Compare the charted boundaries with the planned flight altitude and applicable drone rules.
A frequent interpretation error is reading a base figure without its corresponding ceiling, or treating an MSL altitude as height above the ground. For example, a Class B floor of 2700 feet and ceiling of 9000 feet describes a vertical layer, not a drone’s permitted height. Pair the figures with the chart location and airspace label before making a flight plan.
Clear altitude interpretation supports sound Part 107 planning. Strengthen your understanding of airspace rules with Part 107 training.
AINautics University: Part 107 Training
AINautics University offers Part 107 Training for learners building the knowledge needed to operate drones under Part 107. Turn to this training when you want structured preparation that connects airspace concepts, chart interpretation, and operating rules. For learners who prefer independent study, Self-Paced Certification offers another way to pursue certification preparation. Educators can explore the Train-the-Teacher Program to bring autonomous systems into their curriculum, while the VR Trailer Mobile Lab supports hands-on learning experiences.
Sectional charts are one part of flight readiness. Pairing chart study with focused education can help you develop stronger decision-making skills for future UAS work. Contact AINautics University to explore which learning option fits your goals.
Build chart knowledge into your next step
Understanding FAA sectional charts for drones is a practical foundation for making informed decisions as you build your skills. Strengthen that foundation through deliberate study: connect chart interpretation with the judgment, planning, and aviation awareness expected in UAS work. Each concept becomes more useful when you can explain how it informs a real planning decision.
For students, that learning can help shape a path toward drone and aviation careers. Educators can use the same knowledge to make technical subjects more relevant and help learners connect classroom study with real-world applications. The next step is to choose an educational path that fits your goals, whether you’re preparing for Part 107 or bringing UAS topics into teaching.
AINautics University offers learning options for both individual learners and educators. Explore AINautics University’s programs and keep building the knowledge to move forward with purpose. Your next opportunity starts with what you learn today.
Frequently Asked Questions
How Close Must You Be to an Airport for Class E-SFC to Apply?
Class E-SFC applies where the charted surface area covers your position, not according to a universal airport-distance cutoff. Compare your planned launch point and flight path with the area’s outline; measuring from the airport symbol alone can mislead. If your route runs near an edge, assess the route itself instead of treating the launch location as the only point that matters.
What do the symbols and colors on FAA sectional charts mean?
Use the chart legend to decode symbols and colors, then match each mark to its location and label. A color can identify a category, but it doesn’t explain every detail about a feature. When understanding FAA sectional charts for drones, read the surrounding labels too. This helps distinguish a charted feature from nearby text or lines describing another location.
How can drone pilots read sectional chart airspace classes and boundaries?
Break a planned route into segments wherever it crosses an airspace boundary. For each segment, record the class and relevant altitude information, then compare those details with the intended operation. A route may pass through more than one airspace area, so don’t assume one reading applies to the whole flight. This route-focused approach makes understanding FAA sectional charts for drones more practical.
How do sectional charts show airport locations, runways, and controlled airspace?
Use the airport symbol and identifying label to locate the airport, then examine its runway depiction and surrounding airspace markings. For a planned route, compare the chart location with recognizable geographic features so you don’t confuse a nearby airport with your destination. Keep airport identification separate from whether the planned drone operation is permitted.
How can you use a sectional chart to check whether a drone flight needs FAA authorization?
First identify the exact operating location, not just the town or general area. Then determine which airspace covers that point and whether the planned route stays within it. If the route crosses into another area, assess that segment separately. Plan authorization around the actual operating site and intended flight details, not a broad map pin that may fall on the wrong side of a boundary.
How do drone pilots find military operations areas, restricted areas, and other special-use airspace on sectional charts?
Search the planned area for labeled special-use airspace, then trace its depicted limits against your route. Record the area’s name and type to distinguish it from nearby chart features. If your route approaches one, note the specific segment affected instead of treating the surrounding region as a single airspace area. This makes your chart review more precise and easier to revisit.
How often are FAA sectional charts updated, and where can pilots get current charts?
FAA sectional charts are updated every 56 days, and the FAA provides digital VFR charts online. When selecting a chart, check its edition information and geographic coverage before using it for a planned location. Save or clearly identify the edition used for planning, so you can tell which chart your notes refer to when you review the route again.
How do sectional chart rules apply to recreational drone pilots versus Part 107 operators?
The charts show the same airspace context, but recreational pilots and Part 107 operators must follow the requirements for their respective operations. Part 107 operations generally must stay below 400 feet AGL, subject to the allowance for flight within 400 feet of a structure.

Article by
AINautics University Team
The team behind AINautics University, dedicated to drone education and FAA Part 107 certification prep, VR flight simulation, and STEM training programs for students and educators.


